PAX9 Variants Random Forest Model
Predicting the Effect of PAX9 variants using a Random Forest Model
Abstract
Pax9 is a gene belonging to the family of paired-box genes that encode transcription factors involved in organogenesis. Defects in Pax9 can lead to various types of cancer as well as a condition known as oligodontia which causes missing teeth in individuals. A random forest model was used to predict the phenotypic effect of variants of PAX9. Features that were used include: location of mutation, type of mutation, CADD score, protein change (BLOSUM80 score), and in-frame/out of frame mutation. A 10-fold cross validation was conducted to ensure that the model was not overfitting. The resulting random forest model had an 84.0% prediction accuracy, in which the sensitivity was 89.5%, the specificity was 90.9%, and the precision was 89.5%. However, due to the small size of the available data there are many limitations to the model and involving other features such as other gene interactions would be a major direction of future research on the PAX9 gene.
Introduction/Background
The PAX9 gene belongs to the family of paired box genes (PAX), which are highly conserved across species. It is located on chromosome 14 and codes for a transcription factor which plays a key role in fetal development. Mutations in the PAX9 gene can lead to different types of cancers (especially lung cancer) as well as oligodontia, a congenital defect of more than 6 missing teeth, especially the molars.The members of the PAX gene family usually consist of a paired-type homeodomain, an octapeptide and a paired box domain. The paired box domain is responsible for binding to DNA to facilitate transcription and is one of our major interests to examine whether a mutation in the gene encoding this structure can be an indication of potential cancer or tooth agenesis phenotype. There are five exons that make up the gene transcript for PAX9. The two most important exons for our project include exon 2 (37130902-37131298), which contains four nucleotides including the start codon, as well as exon 3 (37132102-37132728) which contains the majority of the paired box domain.
The features used by the random forest model includes: location of mutation, type of mutation, CADD score, protein change (BLOSUM80 score), and in-frame/out of frame mutation. The location of the mutation was important because preliminary analysis using a chi-squared test determined that the location of the mutation (in the paired box region or not) is not independent to whether an individual exhibits oligodontia. Additionally, many of the features were chosen based on known biological information of genes/proteins. Type of mutation and in frame/out of frame mutation were chosen because synonymous mutations are likely to have little deleterious effect while missense and nonsense mutations are likely to cause a more significant effect on the gene product. Insertions and deletions are likely to cause the most effect on the gene since this can cause a frameshift and thus affect all subsequent amino acids. The effect of the protein change was quantified using a higher valued BLOSUM (BLOSUM80) which is used for closely related sequences as some amino acid changes are more detrimental than others. Finally, CADD score was used as it has a similar objective to our model (predicting the effect of variants) and including other similar models will hopefully improve the ability of our model.
Objective
Utilizing a random forest to classify whether a PAX9 gene variant is pathogenic with the gene data from ClinVar, cBioPortal and gnomAD.
Data Sources
The pathogenic variants were found using cBioPortal (https://www.cbioportal.org/) which contained known variants that cause cancer. Pathogenic variants were also identified from the ClinVar database (https://www.ncbi.nlm.nih.gov/clinvar/) which consists of variants and their corresponding phenotype/condition. ClinVar largely contained variants that resulted in tooth agenesis. If the clinical significance was labelled as “benign” or “likely benign”, they were excluded from the positive variants dataset. It must be noted that there is a risk using ClinVar since there are more lenient standards for submitting data onto the database.
The negative variants were extracted from gnomAD (https://gnomad.broadinstitute.org/) which is an aggregation of genome sequencing data. Although variants from individuals that are affected by severe pediatric disease as well as their first degree relatives were removed, there may still be some individuals affected by severe disease still included. Therefore, this is not a true reference set of alleles. To remove some known disease variants, any overlap between gnomAD and the pathogenic variants were removed from the gnomAD dataset provided that the allele frequency was less than 0.05.
All variants were relative to the GRCh37 reference genome (NG_013357.1).
Computational Methods
Various R packages were used including ‘tidyverse’ and ‘ggplot2’ for manipulating the data as well as ‘peptider’ which contained the BLOSUM80 matrix. The ‘randomForest’ package provided the model for machine learning.
The Ensembl Variant Effect Predictor (VEP) was used to obtain the protein consequence for the ClinVar data while the other two datasets already included protein consequence. A VCF file was produced using the results of VEP and was used to obtain the PHRED score from Combined Annotation Dependent Depletion (https://cadd.gs.washington.edu/) which predicts the deleteriousness of a single nucleotide change as well as insertions and deletions.
Results
Variant Selection
Since there are a lot more variants from gnomAD that are neutral phenotype compared to the number of pathogenic variants, an unbalanced data would form if all of the datasets were included. To combat this, we sampled an equal number of variants that are diseased/not diseased each time we trained our model. Additionally, we used the ten-fold cross validation to make sure that the data is not overfit.
Features
Allele frequency was originally a feature, however, ClinVar did not contain allele frequency and any attempts at obtaining allele frequency using the Ensembl allele frequency calculator were not successful because it only retrieves information for variants identified from the 1000 Genomes Project. While the cBioPortal dataset did have allele frequency, this was the frequency of a cancerous cell with the PAX9 variant out of all the biopsy samples which was not directly comparable to the gnomAD allele frequency value which is in reference to the entire population. Therefore, this feature was removed.
Gene Location
The feature ‘gene location’ was derived from all the variant positions (only using the starting position for convenience) on the chromosome in reference to the human genome GRCh37. The classification of position was built up according to the UCSC genome browser with reference sequence NM_006194. Additionally, we enriched the classification result via the usage of the NCBI analysis on NM_006194.3 since USCS genome browser only provided the exon position. As a result, categories in this feature include:
5’ UTR (37126773-37,131,294) (covering all the exon 1 and majority of exon 2)
Start codon region (37131295-37131298) (at the very end of exon 2)
Exon 3 (37132102-37132728) (contain PAI, RED and KDM5B)
PAI (37132116-37132286)
RED (37132341-37132487)
KDM5B (37132599-37132664)
Exon 4 (37135667-37135806)
Exon 5 (37145403-37145657)
3’ UTR (37,145,658-37147011)
Intron (parts outside of the above regions)
Paired box region
The PAI stands for paired-box region, which encodes a structure for the PAX9 transcription factor to bind to DNA molecules. The RED subdomain aids and corrects PAI’s recognition of DNA sites, and its variant number is larger than PAI, which might account for why PAX proteins have different target genes. The KDM5B protein helps transcriptional repression of some tumor suppressor gene.
BLOSUM80 (amino acid conservation)
The BLOSUM80 score displayed the extent of effect of amino acid change on the stability of the PAX9 protein. We expected that this feature would greatly improve the prediction of our model. R package ‘peptider’ was used to obtain the BLOSUM80 matrix. However, the substitution matrix only considered single amino acid change, so we assumed that variants with a replacement length over one (such as a deletion, frameshift, etc) would get the lowest score since they are more likely to have deleterious effects on the protein structure.
Mutation Type
For the feature of mutation type, it was determined from the original data for gnomAD and cBioPortal. The ClinVar data was processed via VEP to acquire the result. Using the mutation feature and BLOSUM80 matrix, we were able to further classify the data into whether it was in-frameshift and out-of-frame shift since it was expected that frameshift mutation would likely to generate abnormal protein.
CADD PHRED score
CADD PHRED score was obtained by using the coordinates of variants and submitting to VEP. The result produced a VCF file that was submitted to CADD. Some variants such as fusion proteins did not have a CADD score and were given an estimated CADD score ( in this particular case, maximum CADD score was used in replacement) which may not have reflected its true deleteriousness effect.
Pathogenicity
Finally, for the pathogenicity feature–which was our goal of RF prediction–due to the missing allele frequency in most of the cBioPortal and ClinVar it would be nearly impossible to precisely know which variant was neutral or not. Thus, we had to assume that all ClinVar and cBioPortal variants were pathogenic while all gnomAD variants were neutral (after filtering for duplicates) for convenience.
Random Forest
##
## Call:
##  randomForest(formula = phenotype ~ ., data = training_data, importance = T,      ntree = 20, na.action = na.exclude)
##                Type of random forest: classification
##                      Number of trees: 20
## No. of variables tried at each split: 2
##
##         OOB estimate of  error rate: 14.44%
## Confusion matrix:
##            neutral pathogenic class.error
## neutral         75         15   0.1666667
## pathogenic      11         79   0.1222222
The RF model showed that it had an overall accuracy of 85.56%, with 20 decision trees for doing classification tasks. The low value of tree number was due to the limited training data size (80).
## neutral pathogenic MeanDecreaseAccuracy MeanDecreaseGini
## GRCh37Location 6.496823 9.856697 9.376161 25.2817657
## gene_location 1.924800 3.587758 4.798873 8.1996621
## BLOSUM 4.423561 7.614464 6.227631 17.4672859
## Mutation_Type 2.271270 2.648797 2.938764 13.3248609
## inframe 1.025978 0.000000 1.025978 0.4994845
## PHRED 3.754689 1.829102 3.861181 19.7613239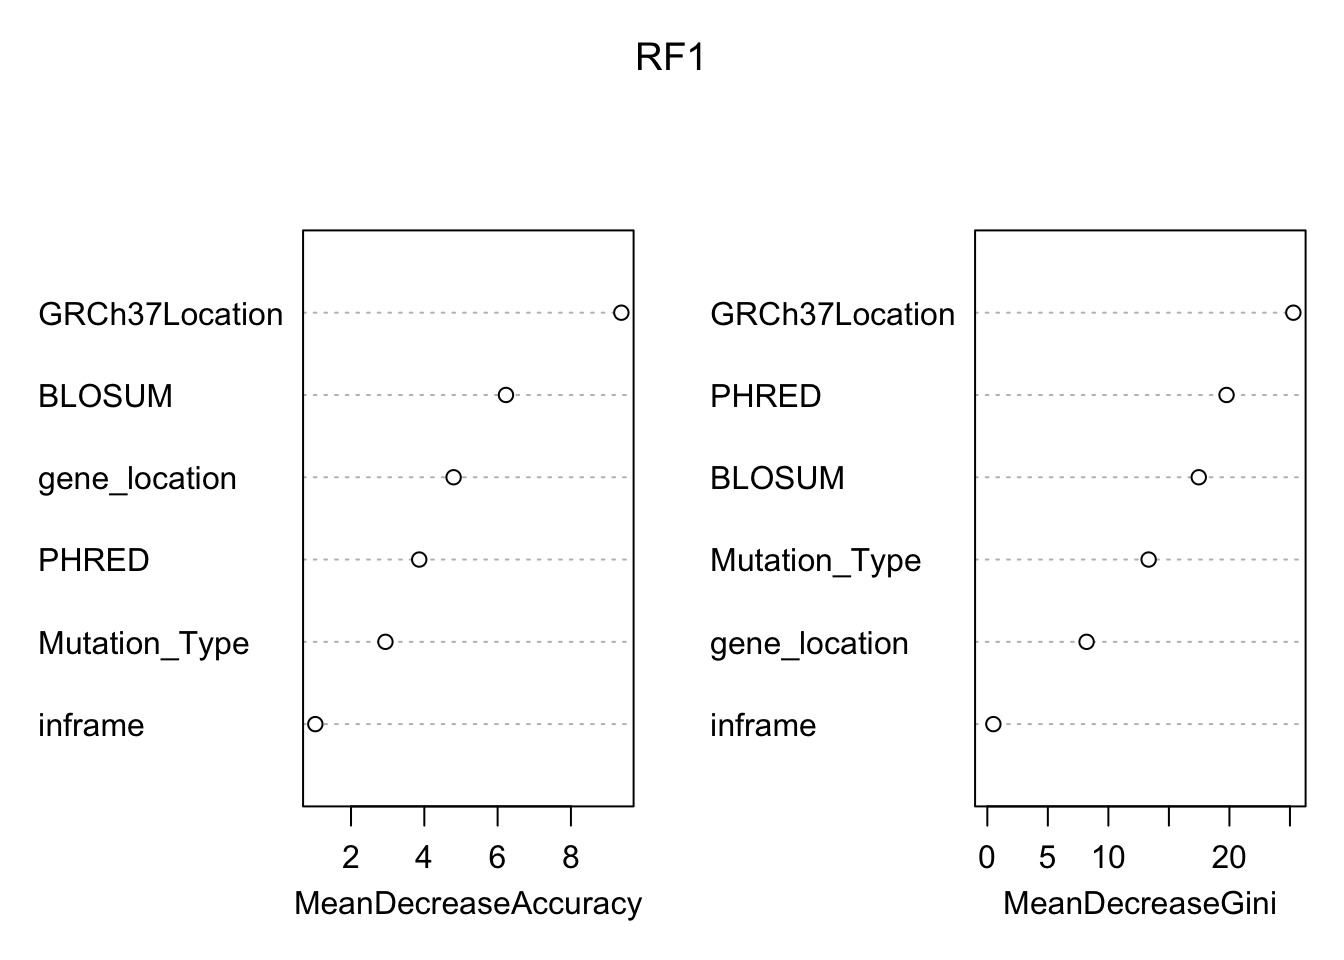 Based on the variable importance plot above, the most important variable would be the location relative to the reference GRCh37. On the other hand, the variable with the smallest effect on the predicting power of our model is inframe. This is expected since there were relatively few variants that caused a frame shift in the population.
Ten-fold Cross Validation
##                           1         2         3         4         5         6
## ten_fold_accuracy 0.8888889 0.7777778 0.8888889 0.8888889 0.7777778 0.8888889
##                           7         8         9        10
## ten_fold_accuracy 0.8333333 0.9444444 0.8888889 0.8888889
Cross Validation mean accuracy:
## [1] 0.8666667By comparing the accuracy between RF (85.56%) and ten-fold (86.67%), we found that despite the low sample size, the model exhibited limited overfitting.
Prediction Result
##             prediction_result
## truth        neutral pathogenic Sum
##   pathogenic       5         17  22
##   neutral         20          2  22
##   Sum             25         19  44
## accuracy sensitivity specificity precision
## pathogenic 0.8409091 0.8947368 0.9090909 0.8947368From the confusion matrix, the model has relatively good accuracy, sensitivity, specificity, and precision.
Conclusion
The objective of the project was to build a random forest model to predict the phenotype of a PAX9 gene variant. The ten-fold cross validation indicated that the model didn’t overfit. While the prediction result was satisfactory, it is important to note that it is only as good as the available training data. It is again acknowledged that there was a risk associated with using the ClinVar resource due to its relatively loose quality check. Additionally, since a large proportion of the allele frequency in cBioPortal and ClinVar was missing, it was difficult to identify all the potential neutral variants and all the variants were assumed to be pathogenic in order to run the RF model. Hence, if possible, allele frequency could potentially be an important feature of any future research on PAX9 gene. Another improvement would be to increase the very limited online human PAX9 gene data to generate more powerful machine learning models. To further refine the prediction of the RF model, a suggestion may be to use the continuous conservation score from other available tools as highly conserved sequences are likely less tolerant to changes. Although BLOSUM80 was insightful on the effect of amino acid substitution on protein structure, adding conservation score could provide a more comprehensive information. Lastly, future research may have a stronger focus on the PAX9’s metabolic pathway. This gene plays a principal role in organogenesis and interacts with many other genes so it is unfortunate that this gene hasn’t received the same attention as other popular genes like p53.
References
- Bonczek et al, ‘PAX9 gene mutations and tooth agenesis: A review’, Clinical Genetics, 2017/02/01, doi: 10.1111/cge.12986. https://www.researchgate.net/publication/313264549_PAX9_gene_mutations_and_tooth_agenesis_A_review
- UCSC genome browser on PAX9. http://www.genome.ucsc.edu/cgi-bin/hgc?hgsid=828585015_qsdofxT4g0z4a48R33zLnyqdtxND&g=htcCdnaAliInWindow&i=NM_006194&c=chr14&l=37126772&r=37147011&o=37126772&aliTable=refSeqAli&table=refGene
- NCBI data on PAX9: https://www.ncbi.nlm.nih.gov/nuccore/NM_006194#feature_NM_006194.3
- Pellizzari et al. Co-operation between the PAI and RED subdomains of Pax-8 in the interaction with the thyroglobulin promoter. Biochem J. 1999;337 ( Pt 2)(Pt 2):253‐262. https://www.ncbi.nlm.nih.gov/pmc/articles/PMC1219959/
- KDB5B gene: https://www.genecards.org/cgi-bin/carddisp.pl?gene=KDM5B
- Ensembl Variant Effect Predictor (VEP): https://useast.ensembl.org/info/docs/tools/vep/index.html
- Combined Annotation Dependent Depletion (CADD): https://cadd.gs.washington.edu/
- cBioPortal: https://www.cbioportal.org/
- ClinVar:https://www.ncbi.nlm.nih.gov/clinvar/
- gnomAD: https://gnomad.broadinstitute.org/
- Random Forest: A. Liaw and M. Wiener (2002). Classification and Regression by randomForest. R News 2(3), 18–22.
- Tidyr package: Hadley Wickham and Lionel Henry (2020). tidyr: Tidy Messy Data. R package; version 1.0.2. https://CRAN.R-project.org/package=tidyr
- Peptider package: Heike Hofmann, Eric Hare and GGobi Foundation (2015). peptider: Evaluation of Diversity in Nucleotide Libraries. R package version 0.2.2. https://CRAN.R-project.org/package=peptider
- Dplyr package: Hadley Wickham, Romain François, Lionel Henry and Kirill Müller (2020). Dplyr: A Grammar of Data Manipulation. R package version 0.8.5. https://CRAN.R-project.org/package=dplyr
Cara Zou
Interests include dentistry and computer science.